Difference between revisions of "ITSV2 & ITSV-3 - Capture Trace"
From Zenitel Wiki
(Created page with "To do a network trace in the ITSV-3 go to '''Maintenance''' > '''System Diagnosis''' > '''Debug''' tab. * At '''One-click Debugging''' select '''Start''' * Reproduce the error...") |
m (Roarl moved page ITSV-3 - Capture Trace to ITSV2 & ITSV-3 - Capture Trace) |
(No difference)
| |
Latest revision as of 10:15, 20 May 2021
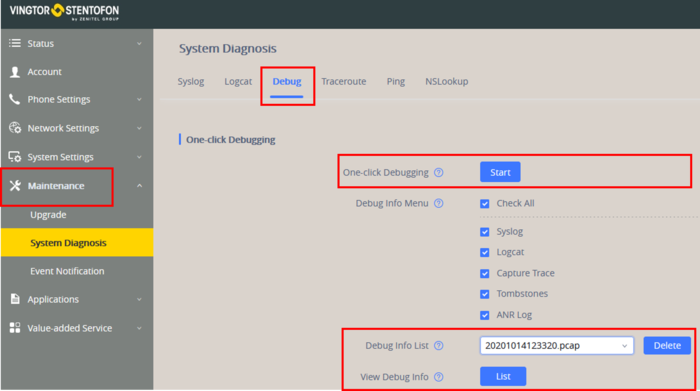
To do a network trace in the ITSV-3 go to Maintenance > System Diagnosis > Debug tab.
- At One-click Debugging select Start
- Reproduce the error, e.g. start a call
- At One-click Debugging select Stop when trace is finished.
To view the trace:
- Select the *.pcap file from Debug Info List, then
- Select List from View Debug Info.
- Now you can Open or Save the *.pcap file for further analysis

