Difference between revisions of "TST console"
From Zenitel Wiki
(→NVRAM editor) |
(→SysLog) |
||
| Line 185: | Line 185: | ||
:- The counters are set to 0 when the total number of messages received reaches 50000 | :- The counters are set to 0 when the total number of messages received reaches 50000 | ||
| − | == SysLog == | + | === SysLog === |
$LOG commands in the event handler and the syslog in general can be viewed in the TST console. Simply type '''''syslog''''' and select the trace level. Level 5 will only show $LOG entries, whilst level 7 will show all the syslog. (New in AMCD 11.1.3.3). | $LOG commands in the event handler and the syslog in general can be viewed in the TST console. Simply type '''''syslog''''' and select the trace level. Level 5 will only show $LOG entries, whilst level 7 will show all the syslog. (New in AMCD 11.1.3.3). | ||
Revision as of 11:25, 14 May 2012
The TST console is a part of the AlphaCom Software. It is primary used as a debugging tool for software developers.
The TST console can be useful for troubleshooting. The TST console also gives direct access to the memory of the AMC-IP board, making it possible to modify parameters not available from the AlphaPro programming tool.
Contents
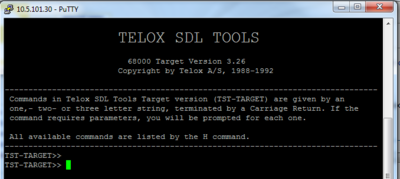
Accessing the TST Console
The TST console is accessed from the Linux Console.
- Start the Linux Console
- On the Linux command prompt, type "tst"
- Now the TST Console is activated
- Press Ctrl-C to exit the TST console and return to Linux console
Command Overview
Type “xh” – to get a list of available commands.
Some commands:
nvram      - Edit NVRAM
sys        - List Misc. System Info
busy       - list busy resources
Evh list   - list all Event handler events
res        - List Hardware Resources by type
nodes      - List all connected nodes
stst       - List connected station state
globgrp    - List global group node memberships
csi        - Execute Command String, Simple Linklayer format
syslog     - Send syslog to TST. Choose tracelevel to 7. 0 = OFF
dno        - Dirno lookup
lbus       - Live update of busy stations and trunks
dt         - (AlphaCom) Dataprotocol Trace mode
NVRAM editor
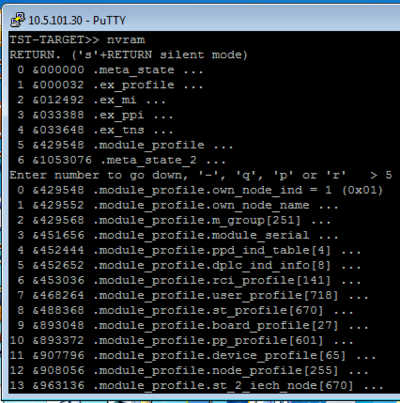
Command: nvram
This command can be use to inspect or modify the nvram memory of the AMC-IP.
Note that modification will not be part of the AlphaPro database
How to use:
- On the TST prompt, type nvram, then <Enter> twice
- You get a menu with line numbers
- Enter a number to select a menu line or a submenu line
- When a value is displayed, it can be changed by typing a new number, then <enter>
- Back one step: press ”-”, then <enter>
- Quit and save: ”q”, then <enter>
Text:
Text strings are presented as a table of byte values
- See the text: ”p”, then <enter>
- Non-pritable chars are presented as hex digits \x00
- Change text: ”r”, then <enter>
- Use the letter ”>” before the start of text
Note: Changes are saved to flash when leaving the NVRAM editor by pressing "q" (quit). Changes will be lost after next reset if not quiting in this way.
List Busy Resources
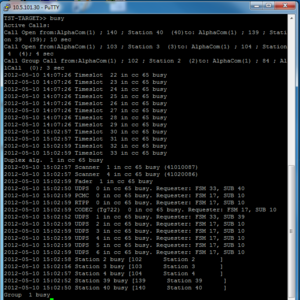
Command: busy
This command will list the resources currently in use in the AlphaCom.
Resources listed are:
Active conversations
Timeslots         - Backplane timeslots, of which there are 256
Faders            - Used by the group call and simplex conference features.
                    2 faders per ASLT, 4 faders per ATLB-12, 12 faders on the AMC-IP.
Scanners          - Used in voice switched conversations. 2 scanners per conversation.
                    Two scanners on each ASLT/ATLB.
Duplex algoritms  - Software resource. One (of 250) per voice switched conversation.
Stations          - Stations currently busy
Group             - Groups currently busy
UDPS              - VoIP channel. Every IP device (IP station, SIP phone, AlphaNet, etc.)
                    which is sending or receiving audio is using one VoIP channel.
                    There are 64 VoIP channels.
PCMC              - PCMC channels are audio links betweeen analog ASLT/ATLB users and
                    VoIP channels on the AMC-IP. There are 32 PCMC channels.
RTPP              -
CODEC             - Used when transcoding is required (to convert from one codec to
                    another). 32 codecs available.
Read Error Buffer
”err” – Read Error Buffer
- International buffer in NVRAM were special events are logged
- Read out buffer to get general impression of the health of the exchange
- Find exact reason for a reset
- The information is very ”software technical”
- Included in the general logging facilities of AlphaCom E
- - Log source ”AlphaCom Debug Log”
- Three levels:
- - Disaster – Exchange reset. The state of the exchange is so bad that the software does a controlled reset to restore normal operation.
- - Error – The software handles a problem by e.g. aborting an operation and returning to idle, but logs a message
- - Warning – Information to the user. Often identical to texts sent to the log port
Remote Login
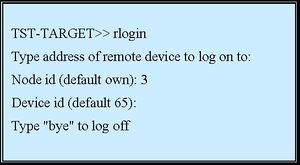
- ”rlogin” – Remote TST Console Feature
- - Log on to the TST on remote node or slave modules
<br\><br\><br\><br\><br\><br\><br\><br\><br\><br\><br\><br\>
- - Type ”bye” to revert back to local exchange, and ”bye” once again to exit TST
List Boards
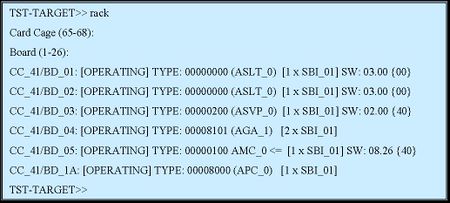
rack” – List Boards
- Gives overview of boards and hardware resources of a board
- Type ”rack” + <enter> + <enter> to list all boards
<br\><br\><br\><br\><br\><br\><br\><br\><br\><br\><br\><br\><br\><br\><br\>
Data Link Trace
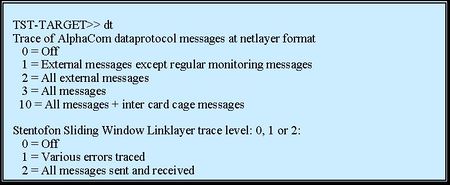
"dt” – Data Link Trace
- Useful to debug AlphaNet or other Data Protocol problems
- Activate by typing ”dt” + <enter>:
<br\><br\><br\><br\><br\><br\><br\><br\><br\><br\><br\><br\><br\>
| To activate a continous error trace: | dt + <enter> + <enter> + 1 + <enter> | |
| Turn off the trace | dt + <enter> + <enter> + <enter> | |
| AlphaNet idle frames: | dt + <enter> + 2 + <enter> + 2 + <enter> | |
| AlphaNet application messages: | dt + <enter> + 1 + <enter> + 2 + <enter> | |
| AlphaNet occational failures: | dt + <enter> + 1 + <enter> + 1 + <enter> | |
When troubleshooting an AlphaNet connection, you should first find out if AlphaNet data link is OK. You can use the dt (data trace) command to check if the AlphaNet data is ok. From the TST prompt enter dt+2+2 to start trace. Enter dt+<enter><enter><enter> to switch it off.
Example 1: AlphaNet on data port 9 (IP). The Send and Receive idle frames shows that the AlphaNet data communication is OK:
DPLC(9) Recv(T1 S5 A0 L4)
DPLC(9) Expect(S5)
DPLC(9) Send(T1 S3 A0 L4)
DPLC(9) Recv(T2 S3 A0 L0)
DPLC(9) DelWin(------)
DPLC(9) Recv(T1 S6 A0 L4)
DPLC(9) Expect(S6)
DPLC(9) Send(T1 S4 A0 L4)
DPLC(9) Recv(T2 S4 A0 L0)
DPLC(9) DelWin(------)
Example 2: AlphaNet on data port 4. The AlphaNet data communication is faulty. You can see Send but no Receive, instead there is a timer started after each Send:
DPLC(4) TIMER in READY, counter: 2
DPLC(4) Send(T1 S1 A0 L4)
DPLC(4) TIMER in READY, counter: 3
DPLC(4) Send(T1 S1 A0 L4)
DPLC(4) TIMER in READY, counter: 4
DPLC(4) Send(T1 S1 A0 L4)
DPLC(4) TIMER in READY, counter: 5
DPLC(4) Send(T1 S1 A0 L4)
DPLC(4) TIMER in READY, counter: 6
Data Link Statistics
”sswrep” – Data Link Statistics
- Shows quality statistics on a data link
- Useful if problems with AlphaNet
- The ”sswrep” command asks for serial port number
- Three counters are displayed:
- - P1: Total number of messages received
- - P2: Number of messages with wrong checksum received
- - P3: Number of messages received out of sequence
<br\><br\><br\><br\><br\><br\><br\><br\><br\><br\>
- - The counters are set to 0 when the total number of messages received reaches 50000
SysLog
$LOG commands in the event handler and the syslog in general can be viewed in the TST console. Simply type syslog and select the trace level. Level 5 will only show $LOG entries, whilst level 7 will show all the syslog. (New in AMCD 11.1.3.3).


