Difference between revisions of "Logging - IP Stations"
From Zenitel Wiki
| (2 intermediate revisions by the same user not shown) | |||
| Line 4: | Line 4: | ||
The logging feature is different in the [[:Category:Stations#INCA_stations|INCA family]]. See bottom of article for details. | The logging feature is different in the [[:Category:Stations#INCA_stations|INCA family]]. See bottom of article for details. | ||
| − | {{note|[[Advanced Configuration Mode (Edge)|Advanced Configuration Mode]] must be enabled to access the Logging on the Zenitel IP | + | {{note|[[Advanced Configuration Mode (Edge)|Advanced Configuration Mode]] must be enabled to access the Logging on the Zenitel IP devices}} |
| − | == Logging | + | == Accessing the Logging page== |
| − | * [[Logging into an IP Station|Log into the IP | + | * [[Logging into an IP Station|Log into the IP device]] |
* Enable [[Advanced Configuration Mode (Edge)|Advanced Configuration Mode]] | * Enable [[Advanced Configuration Mode (Edge)|Advanced Configuration Mode]] | ||
* Select '''Station Administration''' > '''Logging''' | * Select '''Station Administration''' > '''Logging''' | ||
Latest revision as of 15:12, 26 June 2024
This article describes how to enable and collect logs from Zenitel IP Devices. The logs can be useful for debugging and troubleshooting purposes.
The logging feature is different in the INCA family. See bottom of article for details.

|
Advanced Configuration Mode must be enabled to access the Logging on the Zenitel IP devices |
Contents
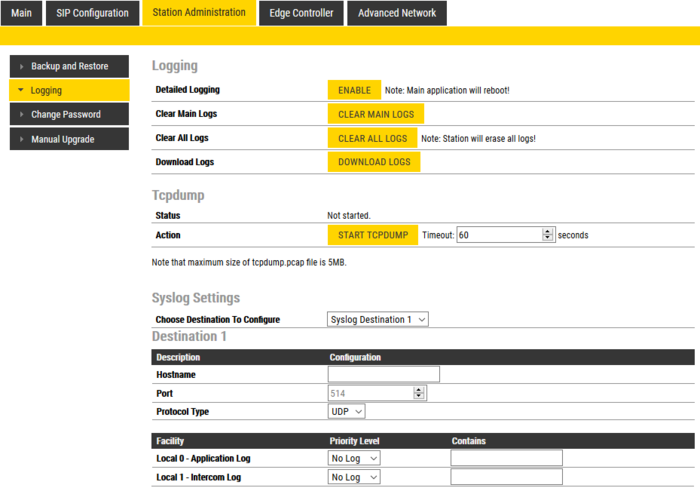
Accessing the Logging page
- Log into the IP device
- Enable Advanced Configuration Mode
- Select Station Administration > Logging
Basic logging
Basic logging is always active. Press the Download Logs button to download the log files to the computer. The log files are in a compressed archive format with file extension .gz.
Detailed Logging
By enabling Detailed logging much more main application events are logged into log files. This is useful when deep-tracing for events that caused issues or for performance bottlenecks.
- Press Enable to start detailed logging.
- Note that the station will do a partial reboot as soon as the Enable button is pressed, and will be out of service for approx. 30 seconds
- When finished with the logging, press Disable to stop the logging
- Press the Download Logs button to download the log files to the computer. The log files are in a compressed archive format with file extension .gz.
Clear Main Logs/Clear All Logs: After having downloaded the log files, they can be deleted from the station to free up space.
Detailed Logging creates some log file(s) that might be read and understood by technicians. These log files are located in the ipst folder. The rest of the logs are meant for software developers. The logs in the "ipst" folder shows the communication between station and server (SIP or DIP protocol, depending on the mode of operation).
Tcpdump tool
- The Tcpdump tool is included as from firmware version 4.7, and is used for collecting all data traffic in and out from the station for the time period specified
- The log file will be on the format .pcap, which can be read by packet analyzing applications such as Wireshark.
- The Tcpdump timeout period can be set between 10 - 3600 seconds
- To start logging press Start tcpdump. The web page will count down the remaining time for the logging session
- You can stop the logging by pressing Stop tcpdump, or you can wait for the timeout period to expire
- When the logging is ended, you need to refresh the web page (e.g. press the menu "Station Administration" > "Logging"), and you will see a link to download the "tcpdump.pcap" file to your PC
- Maximum file size is 5MB. After having downloaded the file to your PC, you should Delete tcpdump file to free up space in the station memory
Syslog Settings
Syslog destination
Up to 3 different syslog server destinations can be configured, and reporting is done simultaneously for all configured destinations. A syslog destination is configured with following settings:
- Hostname: Remote syslog server IP address
- Port: Default is 514
- Protocol type: UDP (default) or TCP
Syslog facility and Log levels
A syslog facility is basically a source of the logging, or the type of the application (program) that is producing and sending log messages. Facilities are used so that logging servers can handle different facilities in different way. Turbine is using two different facilities:
- Application log (facility code 0): System level messages, same as "Detailed logging"
- Intercom log (facility code 1): User-level messages, related to SIP call events
The Priority Level is used to filter out log messages by severity level. The following severity levels are used:
- Warning
- Notice
- Info
- Debug
SIP Call events reported via the Intercom log:
- Warning: Registration lost
- Notice: No answer incoming or outgoing call
- Info: Registration successful
The server process which handles display of messages usually includes all lower (more severe) levels when display of less severe levels is requested. That is, if messages are separated by individual severity, a Warning level entry will also be included when filtering for Notice, Info and Debug messages.
An additional filter field "Contains" can be used to filter out log messages according to a given string input.
Logging in INCA stations
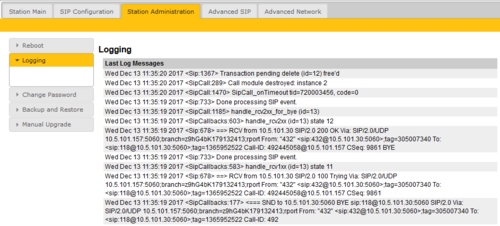
The INCA Stations provide log information when used in SIP or Pulse mode. When used in AlphaCom mode no log data is available.
- Log into the IP Station
- Select Station Administration > Logging
The web interface will show the last 150 lines of SIP related log data.


